
Page 60 - NZPM Annual Report 2017
P. 60
NZPM GROUP ANNUAL REPORT 2017
NOTES TO THE CONSOLIDATED FINANCIAL STATEMENTS (CONTINUED)
For the year ended 31 March 2017
20. FINANCIAL RISK MANAGEMENT (CONTINUED)
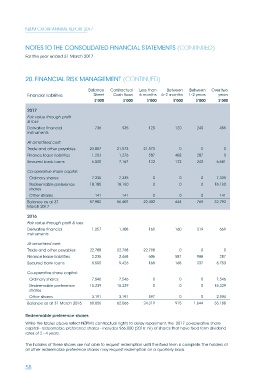
Balance Contractual Less than Between Between Over two
Financial liabilities Sheet Cash flows 6 months 6–2 months 1–2 years years
$’000 $’000 $’000 $’000 $’000 $’000
2017
Fair value through profit
& loss:
Derivative financial 736 935 120 120 240 455
instruments
At amortised cost:
Trade and other payables 23,887 21,573 21,573 0 0 0
Finance lease liabilities 1,203 1,276 587 402 287 0
Secured bank loans 6,500 7,167 122 122 242 6,681
Co-operative share capital:
Ordinary shares 7,335 7,335 0 0 0 7,335
Redeemable preference 18,180 18,180 0 0 0 18,180
shares
Other shares 141 141 0 0 0 141
Balance as at 31 57,982 56,607 22,402 644 769 32,792
March 2017
2016
Fair value through profit & loss:
Derivative financial 1,257 1,308 160 160 319 669
instruments
At amortised cost:
Trade and other payables 22,788 22,788 22,788 0 0 0
Finance lease liabilities 2,235 2,468 606 587 988 287
Secured bank loans 8,500 9,426 168 168 337 8,753
Co-operative share capital:
Ordinary shares 7,546 7,546 0 0 0 7,546
Redeemable preference 15,339 15,339 0 0 0 15,339
shares
Other shares 3,191 3,191 597 0 0 2,594
Balance as at 31 March 2016 60,856 62,066 24,319 915 1,644 35,188
Redeemable preference shares
While the tables above reflect NZPM’s contractual rights to delay repayment, the 2017 co-operative share
capital - redeemable preference shares - includes $66,000 (2016: nil) of shares that have fixed term dividend
rates of 2 - 4 years.
The holders of these shares are not able to request redemption until the fixed term is complete. The holders of
all other redeemable preference shares may request redemption on a quarterly basis.
58