Page 48 - NZPM Annual Report 2020
P. 48

NZPM GROUP LIMITED
             Notes to the Consolidated Financial Statements for the year ended 31 March 2020


                                                                                           2020       2019
                                                                                          $’000      $’000
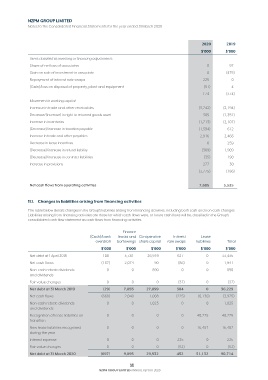
              Items classified as investing or financing adjustments:
              Share of net loss of associates                                                0         97
              Gain on sale of investment in associate                                        0       (475)
              Repayment of interest rate swaps                                             225          0
              (Gain)/loss on disposal of property, plant and equipment                      (51)        4
                                                                                           174       (374)
              Movement in working capital:
              Increase in trade and other receivables                                    (3,742)    (2,194)
              Decrease/(increase) in right to returned goods asset                         305      (1,351)
              Increase in inventories                                                    (1,713)    (2,107)
              (Decrease)/increase in taxation payable                                    (1,394)      612
              Increase in trade and other payables                                        2,916      2,466
              Decrease in lease incentives                                                   0        259
              (Decrease)/increase in refund liability                                      (389)     1,909
              (Decrease)/increase in contract liabilities                                   (35)      190
              Increase in provisions                                                       277         30
                                                                                         (3,775)     (186)


              Net cash flows from operating activities                                    7,605     5,535


             11.1.  Changes in liabilities arising from financing activities

             The table below details changes in the Group’s liabilities arising from financing activities, including both cash and non-cash changes.
             Liabilities arising from financing activities are those for which cash flows were, or future cash flows will be, classified in the Group’s
             consolidated cash flow statement as cash flows from financing activities.


                                                        Finance
                                         (Cash)/bank   leases and  Co-operative   Interest    Lease
                                            overdraft  borrowings share capital  rate swaps   liabilities  Total
                                              $’000      $’000      $’000      $’000      $’000      $’000
              Net debt at 1 April 2018         108      5,781      26,919       627          0      33,435
              Net cash flows                  (137)     2,074         90        (86)         0       1,941
              Non-cash rebate dividends         0           0        890          0          0        890
              and dividends
              Fair value changes                0           0          0        (37)         0        (37)
              Net debt at 31 March 2019        (29)     7,855     27,899        504          0     36,229
              Net cash flows                  (668)     2,040      1,008       (225)     (6,130)    (3,975)
              Non-cash rebate dividends         0           0      1,025          0          0       1,025
              and dividends
              Recognition of lease liabilities on   0       0          0          0      40,775     40,775
              transition
              New lease liabilities recognised   0          0          0          0      16,487     16,487
              during the year
              Interest expense                  0           0          0        225          0        225
              Fair value changes                0           0          0        (52)         0        (52)
              Net debt at 31 March 2020       (697)     9,895     29,932        452     51,132     90,714

                                                           46
                                             NZPM GROUP LIMITED ANNUAL REPORT 2020
   43   44   45   46   47   48   49   50   51   52   53