
Page 64 - NZPM Annual Report 2020
P. 64
NZPM GROUP LIMITED
Notes to the Consolidated Financial Statements for the year ended 31 March 2020
2020 2019
Level
$’000 $’000
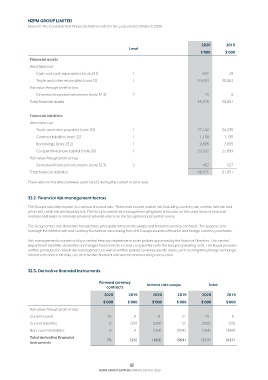
Financial assets
Amortised cost
Cash and cash equivalents (note 23.1) 1 697 29
Trade and other receivables (note 12) 1 34,604 30,862
Fair value through profit or loss
Derivative financial instruments (note 32.3) 2 75 0
Total financial assets 35,376 30,891
Financial liabilities
Amortised cost
Trade and other payables (note 20) 1 27,142 24,235
Contract liabilities (note 22) 1 1,100 1,135
Borrowings (note 23.2) 1 9,895 7,855
Co-operative share capital (note 26) 1 29,932 27,899
Fair value through profit or loss
Derivative financial instruments (note 32.3) 2 452 527
Total financial liabilities 68,521 61,651
There were no transfers between Level 1 and 2 during the current or prior year.
32.2. Financial risk management factors
The Group’s activities expose it to various financial risks. These risks include market risk (including currency risk, interest rate risk and
price risk), credit risk and liquidity risk. The Group’s overall risk management programme focuses on the uncertainty of financial
markets and seeks to minimise potential adverse effects on the Group’s financial performance.
The Group enters into derivative transactions, principally interest rate swaps and forward currency contracts. The purpose is to
manage the interest rate and currency fluctuation risks arising from the Group’s sources of finance and foreign currency purchases.
Risk management is carried out by a central treasury department under policies approved by the Board of Directors. This central
department identifies, evaluates and hedges financial risks in close co-operation with the Group’s operating units. The Board provides
written principles for overall risk management, as well as written policies covering specific areas, such as mitigating foreign exchange,
interest rate and credit risks, use of derivative financial instruments and investing excess cash.
32.3. Derivative financial instruments
Forward currency Interest rate swaps Total
contracts
2020 2019 2020 2019 2020 2019
$’000 $’000 $’000 $’000 $’000 $’000
Fair value through profit or loss:
Current assets 75 0 0 0 75 0
Current liabilities 0 (23) (288) 0 (288) (23)
Non-current liabilities 0 0 (164) (504) (164) (504)
Total derivative financial 75 (23) (452) (504) (377) (527)
instruments
62
NZPM GROUP LIMITED ANNUAL REPORT 2020