
Page 54 - NZPM Annual Report 2017
P. 54
NZPM GROUP ANNUAL REPORT 2017
NOTES TO THE CONSOLIDATED FINANCIAL STATEMENTS (CONTINUED)
For the year ended 31 March 2017
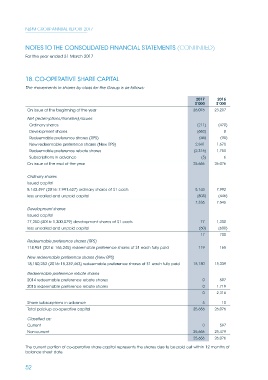
18. CO-OPERATIVE SHARE CAPITAL
The movements in shares by class for the Group is as follows:
2017 2016
$’000 $’000
On issue at the beginning of the year 26,076 23,207
Net (redemptions/transfers)/issues:
Ordinary shares (211) (470)
Development shares (683) 8
Redeemable preference shares (RPS) (46) (95)
New redeemable preference shares (New RPS) 2,841 1,670
Redeemable preference rebate shares (2,316) 1,750
Subscriptions in advance (5) 6
On issue at the end of the year 25,656 26,076
Ordinary shares
Issued capital
8,143,497 (2016: 7,991,627) ordinary shares of $1 each 8,143 7,992
less uncalled and unpaid capital (808) (446)
7,335 7,546
Development shares
Issued capital
77,250 (2016: 1,300,079) development shares of $1 each 77 1,300
less uncalled and unpaid capital (60) (600)
17 700
Redeemable preference shares (RPS)
118,951 (2016: 165,245) redeemable preference shares of $1 each fully paid 119 165
New redeemable preference shares (New RPS)
18,180,253 (2016: 15,339,463) redeemable preference shares of $1 each fully paid 18,180 15,339
Redeemable preference rebate shares
2014 redeemable preference rebate shares 0 597
2015 redeemable preference rebate shares 0 1,719
0 2,316
Share subscriptions in advance 5 10
Total paid-up co-operative capital 25,656 26,076
Classified as:
Current 0 597
Non-current 25,656 25,479
25,656 26,076
The current portion of co-operative share capital represents the shares due to be paid out within 12 months of
balance sheet date.
52